A Comprehensive Guide To Gantt Charts

Introduction
In the realm of project management, visual tools play a crucial role in organizing tasks, timelines, and resources efficiently. One such tool that has stood the test of time is the Gantt chart. In this comprehensive guide, we delve into the intricacies of Gantt charts, their applications, components, creation process, pros and cons, alternatives, and practical steps to kickstart your project with this invaluable tool.
What is a Gantt Chart?
A Gantt chart is a visual representation of a project schedule that illustrates the start and finish dates of various elements of a project. It provides a structured overview of tasks, dependencies, and timelines in a horizontal bar chart format. Named after Henry Gantt, who pioneered its use in the 1910s, Gantt charts have become a cornerstone of project management methodologies worldwide.
What is a Gantt Chart Used For?
Gantt charts serve multiple purposes in project management:
Timeline Visualization: They offer a clear depiction of project timelines, including task durations and dependencies.
Resource Management: Gantt charts help allocate resources effectively by identifying overlapping tasks and potential bottlenecks.
Progress Tracking: Project managers can track progress easily by comparing planned timelines with actual completion dates.
Communication: Gantt charts facilitate communication among project stakeholders by providing a shared visual reference for project status and goals.
Pert Chart vs. Gantt Chart:
While both Pert (Program Evaluation and Review Technique) charts and Gantt charts are project management tools, they serve different purposes:
Pert charts focus on analyzing the time required to complete each task and identifying critical paths in complex projects.
Gantt charts emphasize scheduling and tracking tasks over time, providing a more visual representation of project timelines and dependencies.
Components of a Gantt Chart:
A typical Gantt chart comprises the following components:
Task List: A list of all tasks involved in the project.
Timeline: Horizontal axis representing the project timeline, typically in days, weeks, or months.
Bars: Horizontal bars indicating the duration and timing of each task.
Dependencies: Arrows or lines connecting dependent tasks to illustrate the sequence of activities.
Milestones: Significant points or achievements in the project timeline, often represented by diamond-shaped markers.
How to Create a Gantt Chart:
Creating a Gantt chart involves several steps:
Identify Tasks: List all tasks required to complete the project.
Determine Dependencies: Define the sequence of tasks and identify dependencies between them.
Estimate Durations: Estimate the time required to complete each task.
Assign Resources: Allocate resources (human, financial, and material) to each task.
Choose a Tool: Select a Gantt chart software or template that suits your project needs.
Enter Data: Input task names, durations, dependencies, and start dates into the Gantt chart tool.
Adjust Timeline: Fine-tune the timeline and dependencies to reflect the project's actual workflow.
Review and Share: Review the Gantt chart for accuracy and share it with stakeholders for feedback and approval.
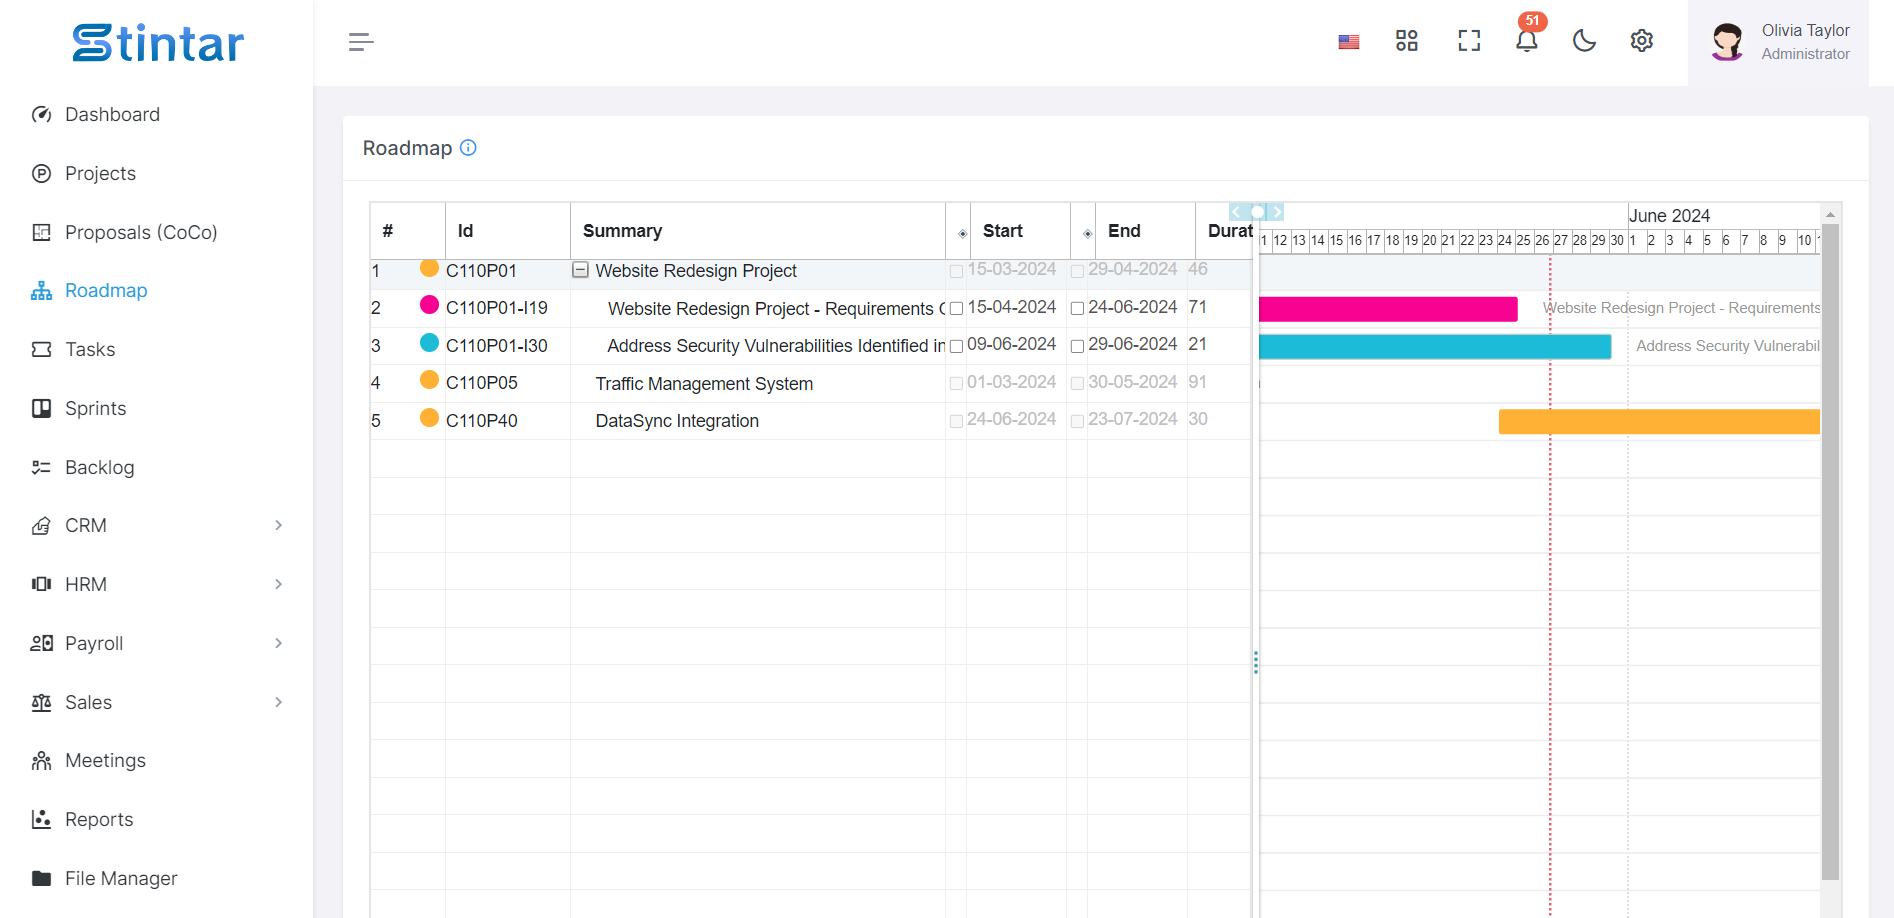
Additionally, you can use the Gantt chart view in Stintar, a comprehensive project management tool that offers intuitive features for planning, tracking, and managing projects effectively. Stintar's Gantt chart view provides a user-friendly interface for creating and customizing Gantt charts, allowing you to visualize project timelines, tasks, dependencies, and resource allocations with ease. With Stintar, you can streamline your project management process and collaborate seamlessly with your team to achieve project success.
Pros and Cons of Using a Gantt Chart in Project Management:
Pros:
Visual Clarity: Provides a clear visual representation of project timelines and tasks.
Efficient Resource Allocation: Helps optimize resource allocation and avoid overloading team members.
Easy Tracking: Enables real-time tracking of project progress and adjustments to schedules as needed.
Communication Aid: Facilitates communication among team members and stakeholders by providing a shared reference point.
Cons:
Complexity: Large projects with numerous tasks and dependencies may result in complex Gantt charts that are challenging to manage.
Static Nature: Gantt charts can become outdated if not updated regularly to reflect changes in project scope or timelines.
Dependency Management: Managing dependencies manually can be time-consuming and prone to errors.
Limited Flexibility: Changes to project timelines or task priorities may require significant adjustments to the Gantt chart.